by Paul Raven (April 2013)
In the beginning
Shortly after I was appointed as national conservation officer at the National Rivers Authority (NRA) in February 1991, one of my first tasks was to oversee publication of the field guidance manual for River Corridor Surveys (NRA, 1992). There was a lot of River Corridor Survey work going on at the time and its benefits for environmentally-sensitive flood defence works were plain to see, because engineers could design their schemes and carry out work using the annotated maps and recommendations produced by surveyors.
But, invaluable though this information was for local conservation staff and river engineers, there was no way of archiving, retrieving, analysing or presenting it in a way suitable for an objective evaluation of the physical state of rivers nationally. We needed to develop a method that could capture the same type of information, but in a more systematic and repeatable fashion and which could be used to establish a national dataset.
In 1992 a radically new approach to river management was being developed by the European Commission. The implications of the then ‘ecological water quality’ proto-Directive (an early precursor of the Water Framework Directive) were profound. Rather than just chemical and biological assessment of rivers, it required a fully ecological approach and by inference, a way of characterising the physical structure of rivers and assessing how this affected biological communities.
Preparing for this step-change in approach was going to mean something new. The NRA needed to develop a method and supporting database for consistently recording, storing and analysing river habitat data.
Ironically, in 1992 the Royal Society for Nature Conservation launched a campaign on rivers called RIVERWATCH. A very simple system for evaluating the chemical, biological and physical state of rivers was developed in conjunction with the NRA and material was distributed to all schools in Britain. A simple database was able to analyse data returns from hundreds of schools and the results were published. At that time the NRA could not provide an objective report on the national state of river habitats. This was an embarrassing shortcoming for the statutory body in charge of managing and reporting on rivers in England and Wales.
Early thoughts
Early thoughts on a national approach centred on using aerial photography to extract information for assessing the morphology of rivers. A feasibility study “River Corridor Strategic Overview” was commissioned and undertaken by the Institute of Freshwater Ecology (IFE) in 1992-3. At the time, remote-sensing imagery and digital data analysis were still in their infancy and data storage capacity was miniscule by today’s standards. The study concluded that it would be too expensive to commission a national aerial survey and to store and analyse the colour photograph images. An MSc project on the river Wyre confirmed that aerial photography could not be used alone for characterising river habitat structure and that ground surveys were needed to gain a full picture of habitats, pressures and impacts (Sansbury, 1994). Twenty years later (2013), the conclusion may not have been the same because of the incredible advances in technology.
So a field survey, based on those features recorded by river corridor surveys, informed by recent functional habitat work on rivers by David Harper at Leicester University was taken forward (Harper & Everard, 1998). A small team, advised by a project board that included external technical experts was formed to take forward and test a method.
An early show-stopper was the incredible variation of recognition and estimation between experienced river corridor surveyors. A seemingly simple task of estimating percentage cover of river-bed substrates or plants over 500m or even a 100m length of river gave surprisingly variable results which meant it was useless for repeat surveys or data analysis. Surveyors were being required to memorise and recall too much information on site. So percentage estimation was abandoned early on in favour of a more structured and sample-based approach.
The second big stumbling block was determining a unit sample length. Originally, it was assumed, quite reasonably, that a variable sample length based on multiples of channel width would be the best way. This was based on the knowledge that morphological features occur in broadly predictable sequences in natural rivers, determined by channel size. But the highly modified nature of streams and rivers across Britain and the major difficulty in determining bank top prevented this approach because there was no guarantee that two surveyors would agree on channel width and therefore sample length. Despite its own shortcomings, a standard unit length was required.
The key attributes for the new method were simplicity and practicality. Surveyors needed to be familiar with what they were observing and the results need to be replicable. Confidence in recording features was the over-riding criterion for quality assurance of the data. To maximise the chance of success we used river corridor surveyors and fish biologists who were familiar with the features recorded, asked them for ideas and these were then tested and revisions made to improve the method.
Prototype testing
A small project team was established in Warrington and Peter Fox led the technical work, which was commissioned and peer-reviewed by the project board. The board was packed with leading national experts on geomorphology, fisheries and conservation, river ecology and statistical methods. Professor Ron Edwards was a key figure for quality control, and being an NRA board member, provided the necessary link to fellow Directors.
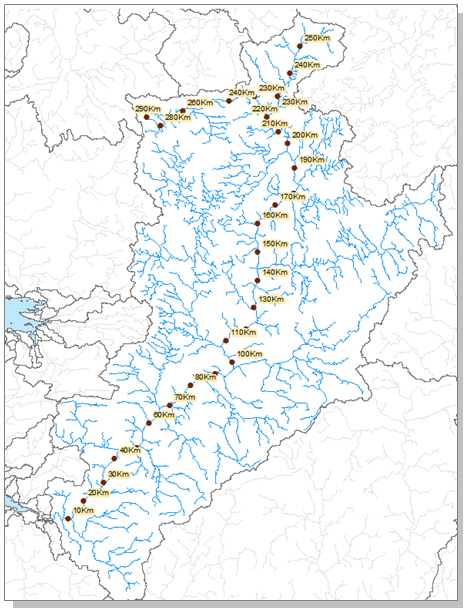
Development work accelerated in 1993 and the prototype method was tested by surveyors on 172 sites. Peter Fox and Marc Naura designed and carried out exhaustive statistical testing to assess confidence in recording a long list of features and modifications and the variation between surveyors recording what they saw along the same stretch of river. From this, the survey protocol and form design emerged. A full account is given in Fox et al., 1998. The survey included the use of transects and a sweep-up summary and recording only predominant river-bed material, flow, bank and river-bed material. A unique set of abbreviations was developed and used as prompts on the survey form to improve confidence in recording. Sampling protocol was determined by cumulative data analysis derived from ‘transects’ every 10m along the upper, middle and lower reaches of the River Derwent in Cumbria. This river was chosen because it changed in character from source to sea and therefore gave a good variation in habitat and modification features. The Derwent work concluded that more than 80% of information could be captured by transects (subsequently called ‘spot-checks’) within 350m (Fox et al., 1998).
The project board had to make some pragmatic decisions that took account of statistical validity and ecological relevance as well as prototype testing results and existing river survey designs. Inevitably there had to be trade-offs. The first was sample length; given that River Corridor Surveys used 500m as a sample length and 350m was the minimum distance needed for the prototype RHS survey, it was agreed to adopt the 0.5km length on the basis that it was familiar and did not compromise data capture. The second was the number of transects within the 500m; it was considered that 10 equidistant ‘spot-checks’, supported by a ‘sweep-up’ summary to capture information was likely to be the most simple and effective frequency, which also allowed the target time of ca. one hour survey to be achieved. The third pragmatic decision was transect width; testing had revealed major variations between surveyors when percentage cover and a full suite of features was included, so a 1m width for physical features and a 10m wide transect for vegetation and bank-top land-use were adopted. Even within the 10m width there was still wide variation in estimating cover percentage, so another trade-off, and probably the most arbitrary, was the use of two categories: 1% as ‘present’ (P) and ≥ 33% (E) as ‘extensive’. For simplicity, these categories were also used for sweep-up attributes.
There was still a lot of testing and refinement to do and inevitably compromises and trade-offs had to be made as the survey protocol and form were re-designed. One key decision, which did not involve compromise, was the need to record the absence of features, as well as their presence. Absence is equally as important as presence for confidence in recording and data analyses.
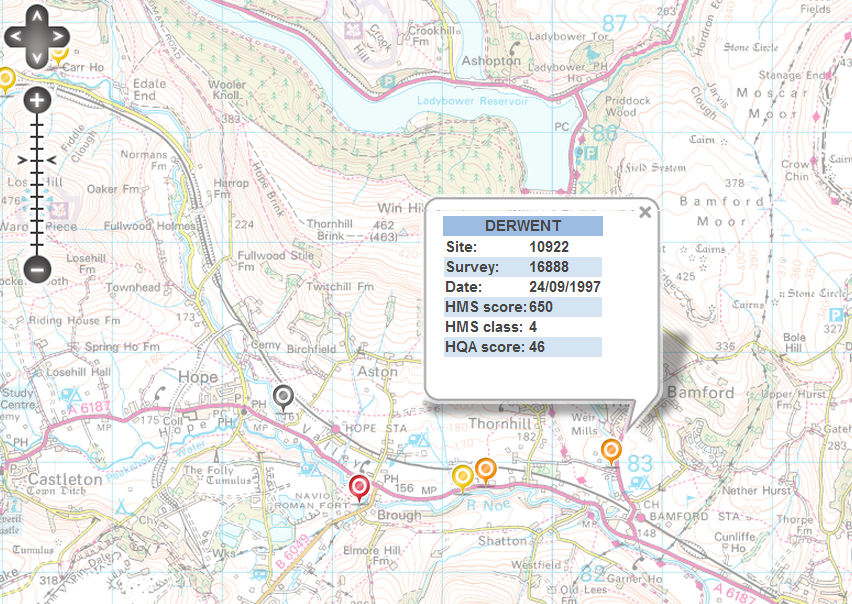
Another area of compromise was the development of the scoring systems-Habitat Quality Assessment (HQA) and Habitat Modification Score (HMS) (Raven et al., 1998). These protocols were derived by expert opinion and originally intended as an interim phase, to be replaced by more sophisticated data-derived scores using the RHS database. Regrettably, further development as intended was thwarted by lack of resources and time and unfortunately, both indices have become de facto headline outputs from the system, despite their shortcomings and dangers of application beyond their intended use. However, as part of a feasibility project on the development of River Habitat Objectives for English and Welsh rivers, HMS was improved and a new scoring system taking account of the extent and resilience of artificial structures was developed by Jim Walker and Kevin Hall (2004).
Establishing a national inventory
Another novel but necessary decision was to derive a national inventory of habitat features and channel modifications across the country, not by simply using existing River Corridor Survey maps, but by a statistically-designed sampling programme. All existing surveys and samples were subjectively selected: River Corridor Surveys were largely confined to those lowland rivers which already had, or were about to have, flood defence works; biological water quality samples were taken near bridges and most were located upstream and downstream from sewage treatment works and other point sources of pollution. We simply could not use these to derive an unbiased inventory or objective assessment. We also needed to be confident that the majority of features occurring right across Britain were included on the survey form prompt-list and properly described in guidance manuals and training courses.
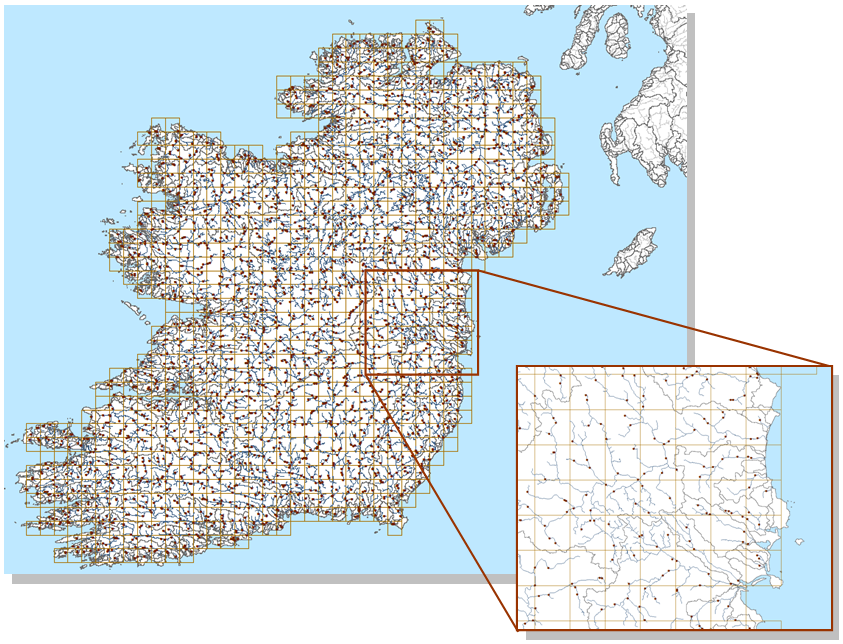
No-one had ever attempted an objective inventory of rivers so this statistical sampling strategy was uncharted territory. A three-year programme (1994-96) of surveys was commissioned and surveyors trained. Sites were selected using a stratified random approach, with the 10km Ordnance Survey grid square acting as the stratifying layer. Three sites would be selected in each and surveyed. For 1994 the site was selected on the basis of ‘centred’ points in the 10km square. This was replaced in 1995 and 1996 by use of randomly-selected 1km squares within the 10km square as a more detailed stratified random framework.
For several reasons, the 1994 survey and resulting data were experimental. The survey was still a prototype and being tested; several definitions were not fully developed; and surveyors were not always confident. In response to the inevitable problems encountered, several amendments were made in time for the 1995 and 1996 survey seasons. These included agreement on ten standard flow-types derived from geomorphological research at NewcastleUniversity (Newson et al., 1998). Quality assurance included production of an illustrated guidance manual, training courses with an accreditation test, double-entry onto the database and logical checks for data validation. Surveyors who passed the test were given an accreditation code valid for 3 years.
Uptake and applications
The main rationale for RHS was to bring together geomorphological and ecological terminology and recording protocols. It required no more than a basic understanding of both disciplines, not detailed knowledge. Perhaps understandably, this novel hybrid approach met with considerable resistance from specialists from both camps; from river corridor surveyors used to mapping their observations on one side, and geomorphologists who considered that RHS didn’t provide enough information for their needs, on the other. Bridging the gap between the two disciplines took a surprisingly long time to close (see separate blog on linking morphology and ecology). Encouragingly, however, external technical colleagues were quicker to see the benefits of the approach than many internal NRA/EA staff. This external support and promotion of the approach and uses of RHS helped to break down internal barriers-eventually. Some staff didn’t really realise its intrinsic value until the Water Framework Directive suddenly opened their eyes to its purpose and application. In hindsight, much more effort was needed to explain the rationale and benefits internally, but we simply didn’t have the resources to run development, testing, deriving a national inventory and indices, securing a working database, training and collating examples of applications.
In the meantime, two more ground-breaking achievements were made. The first UK report on the state of river habitats was published in 1998, based on the 1994-96 baseline survey, plus additional surveys carried out on the Isle of Man. River Habitat Quality contained a foreword signed by the Environment Ministers from England, Wales, Scotland and Northern Ireland (Raven et al., 1998). It had taken 6 years from initial inception of the method to the first national report of its kind in the UK, indeed anywhere in the world. Second, Riverside Explorer, was launched in 2000 after two years of development. It was a slimmed down version of the RHS database with lessons and vocabulary tailor-made for geography pupils and teachers (Hawley et al., 2002). It is still being used today, having withstood the test of time.
It was important, in the light of requirements that assessment methods for the forthcoming Water Framework Directive had to be published after technical peer review, to consolidate the protocols. Equally important was demonstrating the use of RHS, again in scientific papers. The first collective peer review involving a wide range of academics, scientists and practitioners was at a meeting in London in 1998 and this resulted in a special issue of Aquatic Conservation later that year. Entitled ‘The Application of Classification and Assessment Methods to River Management in the UK’ (Boon & Raven, 1998) it contained several papers documenting the development and use of RHS as well as other river assessment methods. This also triggered the wider testing and application of RHS in mainland Europe.
Two other important applications were achieved. First, RHS was used as the standard morphological survey method as part of the STAR project which was inter-calibrating river methods across Europe for application in the Water Framework Directive (Furse et al., 2006; see separate blog on European work). Second, RHS data were an important source of information for SERCON (System for Evaluating Rivers for Conservation), developed, but regrettably never implemented, by the UK nature conservation agencies, under the auspices of Scottish Natural Heritage and the leadership of Phil Boon (Wilkinson et al., 1998).
Conclusions
RHS was a hybrid system, born out of necessity and evolved at the leading edge of convergence between geomorphological and ecological disciplines. Limited resources and technology that was often behind the necessary specification, plus the need to make pragmatic compromises in survey protocol and sampling strategy contributed to a far from perfect but still highly valuable end-product. This, novelty, and a lack of understanding about its use as a WFD tool, produced barriers to its uptake and use. Despite this, the approach, database, major outputs and uses have fully justified the early ‘growing pains’ and subsequent development. Making use of advanced technology and communications should allow its continued refinement, improvement and application a great deal easier.
References
Boon PJ, Raven PJ (eds). 1998. The Application of classification and assessment methods to river management in the UK. Aquatic Conservation, Marine and Freshwater Ecosystems. 8: 1-644.
Fox PJA, Naura M, Scarlett P. 1998. An account of the derivation and testing of a standard field method, River Habitat Survey. Aquatic Conservation, Marine and Freshwater Ecosystems. 8: 455-476.
FurseMT, Hering D, Brabec K, Buffagni A, Sandin L, Verdonschot PFM (eds.) 2006. The ecological status of European rivers: evaluation and intercalibration of assessment methods. Hydrobiologia 566: 1-555.
Harper DL, Everard ME. 1998. Why should the habitat-level approach underpin holisitc river survey and management ? Aquatic Conservation, Marine and Freshwater Ecosystems. 8: 395-414.
Hawley D, Raven PJ, Anstey KL, Crisp S, freeman, Cullis J. 2002. Riverside Explorer: an educational application of River Habitat Survey information. Aquatic Conservation, Marine and Freshwater Ecosystems. 12: 457-470.
National Rivers Authority. 1992.River Corridor Surveys: Methods and Procedures. Conservation Technical Handbook No. 1. NRA, Bristol.
Newson MD, Harper DM, Padmore CL, Kemp JL, Vogel B. 1998. A cost-effective approach for linking habitats, flow types and species requirements. Aquatic Conservation, Marine and Freshwater Ecosystems. 8: 431-446.
Raven PJ, Holmes NTH, Dawson FH, Everard ME. 1998. Quality assessment using River Habitat Survey data. Aquatic Conservation, Marine and Freshwater Ecosystems. 8: 477-500.
Raven PJ, Holmes NTH, Dawson FH, Fox PJA, Everard M, Fozzard, IR, Rouen KJ. 1998.River Habitat Quality: the physical character of rivers and streams in the UK and Isle of Man. Environment Agency, Bristol.
Sansbury, 1994. Survey of the the river Wyre catchment Lancashire testing the River Habitat Survey methodology. September 1994, Master Thesis, LancasterUniversity.
Walker and Hall, 2005, River Habitat Objectives project report. Environment Agency.
Wilkinson J, Martin J, Boon PJ, Holmes NTH. 1998. Convergence of field survey protocols for SERCON (System for Evaluating Rivers for Conservation) and RHS (River Habitat Survey). Aquatic Conservation, Marine and Freshwater Ecosystems. 8: 579-596.
Like this:
Like Loading...
 Figure 1. Stratified sampling of rivers in Ireland. RivEX was used to generate a 10Km grid and sampled each cell 3 times. CCM River and Catchment Database © European Commission – JRC, 2007.

