by Naura, M. & Hornby D. D.
Choosing a sampling strategy
How do you choose survey sites for river characterisation?
In short, it all depends on your overall aims.
The sites chosen for the River Habitat Survey (RHS) baseline surveys in 1994-6 and 2007-8 were originally identified from Ordnance Survey1:50,000 Landranger maps using a stratified sampling strategy using a 10km grid. The aim was to get a representative picture of river habitats across England and Wales. The stratification was introduced to provide a sample that could also be used to characterise smaller geographical units such as river basins or catchments. Random sampling strategies without stratification may indeed produce clusters of sites in parts of the country and leave some areas unsampled. In the end, 3 RHS site locations were randomly selected within every 10km-square in England, Wales and Scotland.
Stratification can be performed according to a geographical area (e.g. squares or catchment boundaries), a river type or stream orders. It all depends on your specific reasons for introducing a stratum in your sample. If your aim is to compare the distribution of features across river types, you may want to stratify according to a set typology or stream orders. If your aim is to compare counties or states, then state or county boundaries may be used to stratify your sample.
You need to remember that you need to account for the effect of stratifying your sample when analysing the data. For example, a geographical stratification using squares (e.g RHS baseline surveys) may introduce a bias when analysing the overall sample as a whole as it gives more weight to squares with low stream densities. If, following survey, you find that 80% of your sites are heavily modified, it could be wrong to state that 80% of rivers in your geographical area are modified because unmodified streams in upland and headwaters squares will be under-represented compared to modified streams in lowland squares. You would need to correct your statistics using stream densities for each square.
There are other methods for sampling. One is to select sites at regular intervals (e.g. every 2km along the network from source to sea). Regular samples generate unbiased statistics as long as the chosen sampling interval does not correspond to the ‘wave length’ of the features you want to record. For example, the distribution of features such as riffles is a function of channel bankfull width. Now imagine that a specific habitat feature tend to occur every 2000m. Depending on your starting point, a 2km regular sampling strategies may completely miss the feature out. It is therefore important to make sure that the interval between survey sites does not correspond to the interval of occurrence of features you want to record.
Selecting your sites
When we put together the first RHS baseline survey in 1994, site selection was done by hand. This required quite a bit of work by a team of people who had to select every site using paper maps and random number tables (for more details click here). The method used for stratification itself introduced some bias. Indeed, sites were selected in every 10km-squares by further dividing them into 2km-squares. A 2km-square would then be chosen at random and the point on the river closest to the centre of the square would represent the midpoint of the RHS site. This selection method meant that large rivers were more likely to be selected than narrower ones potentially introducing a bias based on river width.
Geographical Information System (GIS) can help automate the identification of suitable river survey sites and reduce sampling bias. GIS can save significant time and money; reducing an intensive manual process which requires a team of people, to an individual pressing a button and obtaining a selection of sites within minutes!
GIS selection is not bias free though! I have seen algorithms implementing ‘random’ samples by randomly selecting polylines in a river network. Because polylines will be of different lengths, the sample obtained is likely to be biased towards small polylines (e.g. 1m) that will be over-represented in the network compared to longer ones (e.g. 10km).
To generate random samples for my research, I used RivEX which is an ArcGIS 10.1 AddIn that can automate the sampling of river networks. Provided you possess a valid network (a topologically correct centreline network), you can generate sampling locations using random or regular sampling strategies in RivEX.
With regular sampling you can generate points on the network:
● for each line of the network
● at a user specified stepping distance from network mouth
With random sampling you can generate points on the network:
● by sampling the whole network
● by stratifying the sampling with a user defined grid
● by stratifying the sampling with a user supplied polygon layer
Each sampling point generated is snapped to the river network and have attributes of ID, XY coordinates, intersecting polyline ID and in the case of supplying a polygon layer the polygon ID. The sampling points generated can form the basis for your catchment or river survey but you can also use them to:
● transfer metrics encoded into the network to the sampling points such as distance to network mouth or Strahler order;
● query other spatial layers (e.g. geology, land use or authority boundaries);
● generate catchment boundaries using an appropriate DEM;
● answer network tracing problems such as identifying the nearest site downstream or upstream.
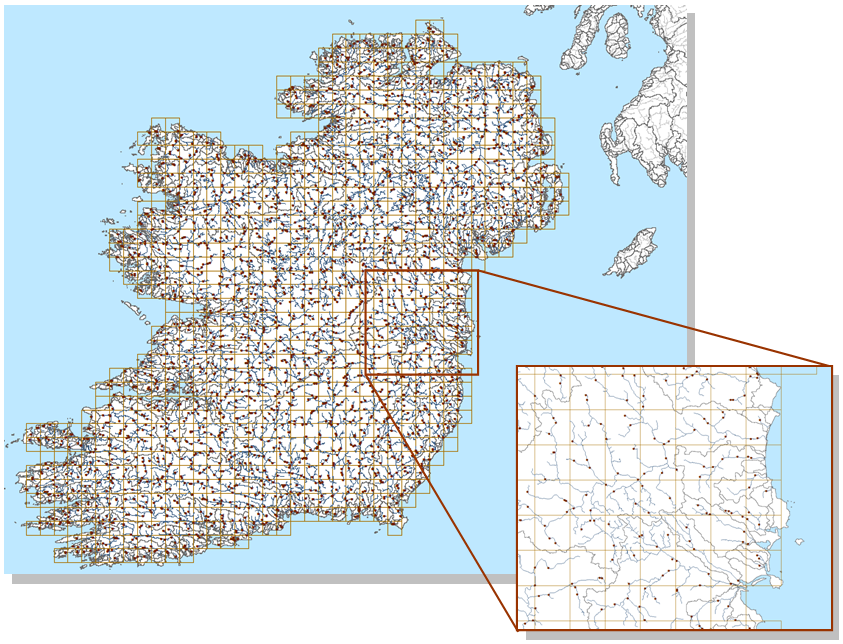
The tool is scalable allowing you to generate sampling points at a national, regional or sub-catchment level. Figure 1 demonstrates stratified sampling using CCM data for Ireland. A 10Km grid is built and each cell sampled 3 times, the entire process took only 30 seconds!
 Figure 1. Stratified sampling of rivers in Ireland. RivEX was used to generate a 10Km grid and sampled each cell 3 times. CCM River and Catchment Database © European Commission – JRC, 2007.
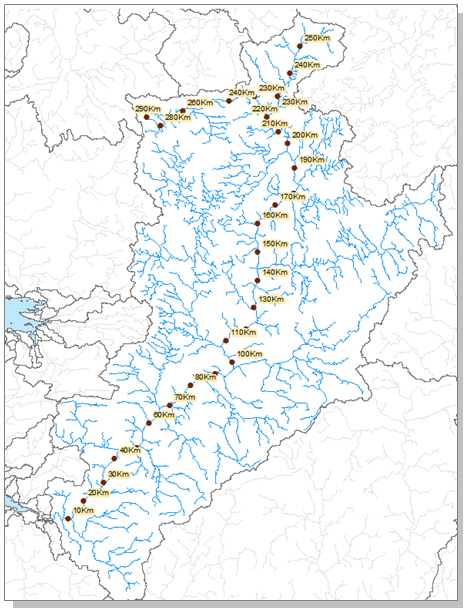
With RivEX you can generate regularly spaced sampling points at a user specified distance from the network mouth. Figure 2 show the river Shannon in Ireland sampled every 10Km. Such a dataset would be vital for a walk over campaign allowing your field surveyors to survey the river at known coordinates. I personally used this very useful function to extract GIS data for typing rivers and implementing predictive models.
Figure 2. Regular sampling of the main stem of the river Shannon, Ireland, with a stepping distance of 10Km. CCM River and Catchment Database © European Commission – JRC, 2007.
Conclusion
Defining a sampling strategy is a very important first step in any project aimed at characterising a river catchment or area. The choice of sampling strategy, method and intensity as well as the tool used are crucial and require careful consideration with regards to potential biases introduced. Tools exist that can help with automate the procedures and reduce bias.
For more information, read Jeffers, J. N. R. 1979 Sampling. Cambridge, Institute of Terrestrial Ecology, 7pp. (Statistical Checklist, 2). (Link to publication online)

